Need help with position control of Odrive motor D6374 150 KV

Hello Odrive community,
I have written this code for position control of Odrive motor D6374 150 KV using Odrive controller v.3.6 56V. But there seems to be some error. Could someone guide and help me fix it please. I am running this python script in Spyder IDE. I am new to Spyder too. So any help would mean a lot to me.
Thanks.

import odrive
from odrive.enums import *
import time
import numpy as np
from matplotlib import pyplot as plt
from odrive.utils import start_liveplotter

Connect to ODrive

odrv0 = odrive.find_any()
print(str(odrv0.vbus_voltage))
#configuring prarameters
odrv0.axis0.motor.config.current_lim = 10
odrv0.axis0.controller.config.vel_limit = 8
odrv0.config.enable_brake_resistor = True
odrv0.config.brake_resistance = 2
odrv0.axis0.motor.config.pole_pairs = 7
odrv0.axis0.motor.config.torque_constant = 8.27/150
odrv0.axis0.motor.config.motor_type = MOTOR_TYPE_HIGH_CURRENT
odrv0.axis0.encoder.config.cpr = 16384
#save=odrv0.save_configuration()

#calibration
odrv0.axis0.requested_state = AXIS_STATE_FULL_CALIBRATION_SEQUENCE
time.sleep(0.1)

#necessary for plotting?
odrv0.axis0.requested_state = AXIS_STATE_ENCODER_OFFSET_CALIBRATION
odrv0.axis0.encoder.config.pre_calibrated = True

odrv0.axis0.requested_state = AXIS_STATE_CLOSED_LOOP_CONTROL

odrv0.axis0.controller.config.control_mode = CONTROL_MODE_POSITION_CONTROL

odrv0.axis0.trap_traj.config.vel_limit = 10.0
odrv0.axis0.trap_traj.config.accel_limit = 20.0
odrv0.axis0.trap_traj.config.decel_limit = 20.0

odrv0.axis0.controller.config.input_mode = INPUT_MODE_TRAP_TRAJ
odrv0.axis0.controller.config.pos_gain = 2
#varibales for plotting
t = np.linspace(-np.pi, np.pi, 12)
#w=(2*np.pi)/t

t_arr = np.array([t])
estimates =
for i in range (len(t)): #cannot take the entire array just the values using array index
setpoint = np.sin(t[i]) #should it be 2piT?
odrv0.axis0.controller.input_pos = setpoint

#plt.plot(t, x)
#plt.show()
#setpoint = np.array()

while True:
    estimate = odrv0.axis0.encoder.pos_estimate
    if np.abs(estimate - setpoint) < 0.001:
        break
    
    time.sleep(0.001)
    estimates.append(estimate)

#odrv0.axis0.controller.move_incremental(pos_increment, from_goal_point)

#starting liveplotter
#graph = start_liveplotter(lambda:[estimate,setpoint])
odrv0.axis0.controller.input_pos = 0

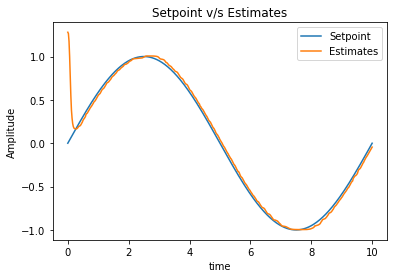
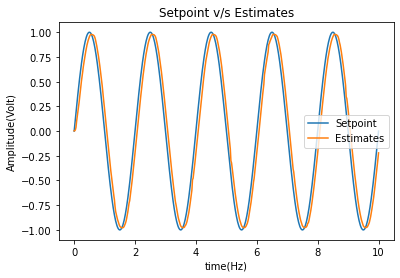
plt.plot(t, np.sin(t), label=‘Setpoint’)
plt.plot(t, estimates, label=‘Estimated value’)
plt.legend()
plt.show()
quit()

1 Like

I realized that I had done a few mistakes in generating the sine wave. I changed the code in the script later and was finally able to do the position control. I am attaching the plots for reference for anyone who is new to Odrive or motor control in general.
set point estimate final
high frequency pos ctrl

The first plot is for low frequency and the second one is for a higher frequency.

I’m glad you were able to fix the code!
For posterity’s sake, would you mind including the changes you made to fix it?

1 Like

Sure, Happy to help. Here is the code that got me the results!

import odrive
from odrive.utils import start_liveplotter
from odrive.enums import *
from matplotlib import pyplot as plt
import time
import math
import numpy as np

Connect to ODrive

odrv = odrive.find_any()

print(odrv)

Set axis parameters

odrv.axis0.requested_state = AXIS_STATE_FULL_CALIBRATION_SEQUENCE
time.sleep(1)

#odrv.axis0.requested_state = AXIS_STATE_ENCODER_OFFSET_CALIBRATION
#odrv.axis0.encoder.config.pre_calibrated = True

odrv.axis0.requested_state = AXIS_STATE_CLOSED_LOOP_CONTROL

odrv.axis0.controller.config.control_mode = CONTROL_MODE_POSITION_CONTROL
axis = odrv.axis0
axis.motor.config.current_lim = 10
axis.controller.config.vel_limit = 10

Set trajectory parameters

amplitude = 1 # set the amplitude of the sinusoidal trajectory
frequency = 0.1# set the frequency of the sinusoidal trajectory
trajectory_time = 10 # set the time over which to execute the trajectory
num_points = 500 # set the number of points in the trajectory

Generate sinusoidal trajectory

times = [trajectory_time * float(i) / (num_points - 1) for i in range(num_points)]
positions = [amplitude * math.sin(2 * math.pi * frequency * t) for t in times]

plt.plot(times, positions, label=‘Setpoint’)
plt.xlabel(“time”)
plt.ylabel(“Amplitude”)
plt.legend()
plt.show()

#Execute trajectory and read the position from the encoder (stuck in this part)
#to store the estimated values from the encoder
Estimates =
for i in range(len(positions)):
pos = positions[i]
axis.controller.input_pos = pos #command to set the generated trajectory as the setpoint/input position
estimate = axis.encoder.pos_estimate
Estimates.append(axis.encoder.pos_estimate)
#print(pos)
print(f"pos: {pos}, estimate: {estimate}")
time.sleep(0.01)

#starting liveplotter
#graph = start_liveplotter(lambda:[Estimates,pos]) #plot of setpoint vs estimated positions from encoder
plt.plot(times, positions, label=‘Setpoint’)
plt.plot(times, Estimates, label=‘Estimates’)

plt.xlabel(“time(s)”)
plt.ylabel(“Amplitude(Volt)”)
plt.title(“Setpoint v/s Estimates”)

plt.legend()
plt.show()

Stop motor

axis.controller.input_pos = 0
time.sleep(1)
axis.requested_state = AXIS_STATE_IDLE

2 Likes